The latest video and SEO statistics show that video is mainstream in marketing: 91% of businesses use it, according to Wyzowl’s 2026 survey. At the same time,according to TechCrunch, YouTube Shorts now averages 200 billion daily views, and Google says video can surface across Search, Video mode, Images, and Discover.
This page brings together current video and SEO statistics on adoption, search visibility, YouTube, AI, engagement, conversion, consumer behavior, budgets, and ad spend.
Quick answer: The strongest video and SEO statistics signal is scale: 91% of businesses use video in 2026, while YouTube Shorts averages 200 billion daily views.
Key Stats at a Glance
- 91% of businesses use video as a marketing tool in 2026. (Wyzowl)
- 82% of video marketers say video increased web traffic in 2026. (Wyzowl)
- 200 billion Shorts views occur on an average day in 2026. (YouTube)
- $72.4 billion was the projected 2025 U.S. digital video ad spend. (IAB)
- 1.5+ billion users reached by AI Overviews in 2025. (Google)
Video Marketing Adoption and Production
Video is already a standard marketing format, so the useful question is how teams produce it and which formats they choose. These video and SEO statistics show adoption, production models, and the content types marketers are making now.
Adoption and Strategy
- 91% of businesses use video as a marketing tool in 2026. (Wyzowl)
- 93% of video marketers say video is an important part of their strategy in 2026. (Wyzowl)
- 67% of non-video marketers plan to start using video in 2026. (Wyzowl)
Barriers to Video Adoption Among Non-Video Marketers
| Barrier | Share |
| Video is not needed | 24% |
| Video is too expensive | 24% |
| Lack of time | 19% |
| Unclear about video ROI | 10% |
| Do not know where to start | 10% |
| Cannot convince decision-makers | 5% |
| Negative past experience | 5% |
Source: Wyzowl, 2026
Video Production Formats
- 51% of video marketers mainly create live-action video. (Wyzowl)
- 23% of video marketers mainly create animated video. (Wyzowl)
- 19% of video marketers mainly create screen-recorded video. (Wyzowl)
Production Models
| Production Model | Share |
| Fully in-house | 59% |
| Mixed internal and external | 32% |
| External vendors only | 10% |
Source: Wyzowl, 2026
Details:
- 59% of video marketers create video fully in-house. (Wyzowl)
- 32% of video marketers use a mix of internal and external production. (Wyzowl)
- 10% of video marketers rely exclusively on external vendors. (Wyzowl)
Video Content Types Created
| Content Type | Share of Video Marketers |
| Social media videos | 69% |
| Explainer videos | 68% |
| Testimonial videos | 57% |
| Presentation videos | 48% |
| Video ads | 48% |
| Teaser videos | 45% |
| Product demos | 39% |
| Sales videos | 37% |
| Videographics | 27% |
| Customer service videos | 24% |
| Training videos | 23% |
| Customer onboarding videos | 23% |
| App demo videos | 17% |
| Employee onboarding videos | 16% |
Source: Wyzowl, 2026
Production Analysis
- Wistia’s 2026 study surveyed 900+ professionals and analyzed more than 13 million videos.
- Wistia analyzed 79 million hours of viewing data for its 2026 State of Video report.
Key implication: For teams planning video SEO, the adoption numbers point to a crowded supply side. Search performance depends less on simply publishing video and more on matching format, topic, page placement, and metadata to a clear query.
AI, Budgets, and Video Workflows
Production economics are changing as AI becomes part of the workflow. The following statistics cover budgets, accessibility, resolutions, and how AI use differs among high-volume teams.
AI Adoption in Video Production
- 63% of video marketers have used AI tools to create or edit marketing video in 2026. (Wyzowl)
- 37% of video marketers had not used AI video tools in 2026. (Wyzowl)
- AI use for video rose from 51% in 2025 to 63% in 2026, a 12-point increase. (Wyzowl)
- 33%+ of teams already use AI in their video workflow in 2026. (Wistia)
- Nearly 25% more teams plan to begin using AI in their video workflow. (Wistia)
AI Usage Patterns and Effects
- Daily video producers are 58% more likely to use AI than less frequent producers. (Wistia)
- AI users are 57% more likely to produce 50 to 100 videos. (Wistia)
- AI users are 2 times as likely to produce 100 to 250 videos. (Wistia)
- AI users are 82% more likely to provide subtitles in multiple languages. (Wistia)
- AI users are 50% more likely to use audio descriptions. (Wistia)
- AI users are 27% more likely to make product videos. (Wistia)
- AI users are 52% more likely to make ads. (Wistia)
Budget Allocation
- 46% of marketers allocate one-third or less of their budget to video. (Wyzowl)
- 17% of marketers do not track how much they spend on video. (Wyzowl)
- 92% of video marketers plan to spend the same or more on video in 2026. (Wyzowl)
- 41% of video marketers spent money on video ads in 2026. (Wyzowl)
- Paid video-ad use rose from 36% in 2025 to 41% in 2026, a 5-point increase. (Wyzowl)
Production Cost Trends
- 30% of video marketers say production costs are getting cheaper. (Wyzowl)
- 32% say production costs are unchanged. (Wyzowl)
- 38% say production costs are increasing. (Wyzowl)
Video Accessibility and Formats
- 90% of teams were already taking steps to make video accessible in 2026. (Wistia)
Format Upload Trends (Year-over-Year):
| Format | YoY Change |
| Vertical HD uploads | +24% |
| 4K uploads | +16% |
| 720p uploads | -8% |
| Square uploads | -4% |
Source: Wistia, 2026
Key implication: AI is lowering friction in parts of production, while budget growth is more selective. The practical SEO implication is to use automation for repeatable work such as captions and localization, then keep human review on search intent, claims, and quality.
Video ROI, Traffic, Engagement, and Conversion
Traffic and rankings matter, but video programs are usually funded on measurable business outcomes. These statistics focus on ROI, web traffic, lead generation, sales, click-through behavior, and engagement benchmarks.
ROI Measurement and Effectiveness
- 82% of marketers say video gives them a good ROI in 2026. (Wyzowl)
- Video ROI fell from 93% in 2025 to 82% in 2026, an 11-point decline. (Wyzowl)
How Marketers Measure Video ROI
| Measurement Method | Share of Video Marketers |
| Video views | 67% |
| Engagement (likes, shares, reposts) | 63% |
| Leads or clicks | 52% |
| Customer engagement and retention | 40% |
| Brand awareness or PR | 36% |
| Bottom-line sales | 32% |
Source: Wyzowl, 2026
Business Impact Metrics
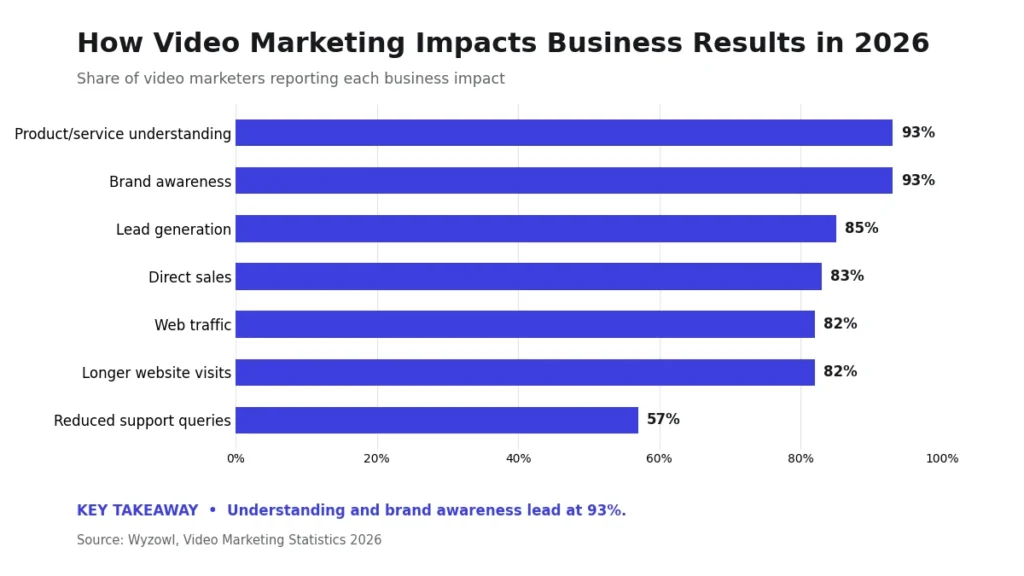
- 93% of video marketers say video increased product or service understanding. (Wyzowl)
- 93% say video increased brand awareness. (Wyzowl)
- 82% say video increased web traffic. (Wyzowl)
- 85% say video generated leads. (Wyzowl)
- 83% say video directly increased sales. (Wyzowl)
- 82% say video kept visitors on their websites longer. (Wyzowl)
- 57% say video reduced support queries. (Wyzowl)
Video Effectiveness and Length
- 71% of people say videos from 30 seconds to 2 minutes are the most effective length. (Wyzowl)
- Brand-awareness impact moved from 90% in 2024 to 96% in 2025 and 93% in 2026, showing a 3-point pullback in the latest year. (Wyzowl)
Lead Generation and Click-Through Rates
Wistia’s 2026 analysis of lead-generation forms placed in videos shows:
- 5 to 30 minute videos: 53% to 55% click-through rates when placed in the 1st, 2nd, or 4th quarters.
- 30 to 60 minute videos: 50% to 51% click-through rates when placed in the 1st or 4th quarters.
- 60+ minute videos: 67% to 75% click-through rates when placed in the 2nd or 4th quarters.
| Video Length | High-Performing Placement | Click-Through Rate |
| 5 to 30 minutes | 1st, 2nd, 4th quarters | 53% to 55% |
| 30 to 60 minutes | 1st, 4th quarters | 50% to 51% |
| 60+ minutes | 2nd, 4th quarters | 67% to 75% |
Source: Wistia, 2026
Engagement by Video Type and Length
- 30 to 60 minute videos generated the highest click rates among video-length groups. (Wistia)
- Shorter videos have higher average engagement rates, even though longer videos can generate more total watch time. (Wistia)
- Educational and tutorial videos led engagement among video types in 2026. (Wistia)
- Videos under three minutes performed best for food and beverage plus retail and ecommerce engagement. (Wistia)
- 3 to 30 minute videos performed best for software and technology engagement. (Wistia)
Key implication: Track impressions and rankings, but pair them with play rate, watch behavior, assisted conversions, leads, and sales so video SEO is tied to outcomes.
Consumer Video Behavior and Purchase Influence
Search visibility has more value when the content also helps people understand and choose products. These statistics show how consumers use video during research and purchase decisions.
Consumer Video Usage
- 96% of people have watched an explainer video to learn about a product or service. (Wyzowl)
- 85% of people have been convinced to buy a product or service after watching video. (Wyzowl)
- 80% of people have bought or downloaded an app after watching an app demo video. (Wyzowl)
Consumer Preferences and Trust
- 84% of consumers want to see more videos from brands. (Wyzowl)
- 89% of consumers say video quality affects their trust in a brand. (Wyzowl)
- Consumer trust tied to video quality fell from 91% in 2025 to 89% in 2026, a 2-point decline. (Wyzowl)
Preferred Content Format for Product Learning
- 63% of consumers prefer a short video to learn about a product or service. (Wyzowl)
- 12% prefer a text article, website, or post. (Wyzowl)
- 7% prefer an infographic. (Wyzowl)
- 5% prefer a sales call or demo. (Wyzowl)
- 4% prefer an ebook or manual. (Wyzowl)
- 4% prefer a webinar or pitch. (Wyzowl)
| Format | Consumer Preference |
| Short video | 63% |
| Text article, website, or post | 12% |
| Infographic | 7% |
| Sales call or demo | 5% |
| Ebook or manual | 4% |
| Webinar or pitch | 4% |
Source: Wyzowl, 2026
Comparative Preference Metrics
- Compared with the 12% who prefer text, consumers are 51 percentage points more likely to choose short video for product learning. (Wyzowl)
- Short video’s 63% preference is 9 times the 7% preference for infographics. (Wyzowl)
- Short video’s 63% preference is more than 15 times the 4% preference for webinars or pitches. (Wyzowl)
Key implication: Consumers show a strong preference for learning through short video, but quality still affects trust. For search pages, the useful pattern is a concise video that answers the query quickly and supports the surrounding text rather than replacing it.
Platform and YouTube Video Statistics
Platform choice shapes discoverability. These statistics compare marketer usage and effectiveness, then add current YouTube scale signals that matter for search-led video strategies.
Video Platform Usage by Marketers
- 82% of video marketers use YouTube. (Wyzowl)
- 70% use LinkedIn. (Wyzowl)
- 69% use Instagram. (Wyzowl)
- 66% use Facebook. (Wyzowl)
- 56% use webinars. (Wyzowl)
- 40% use TikTok. (Wyzowl)
- 31% use interactive video. (Wyzowl)
- 29% use X. (Wyzowl)
- 19% use VR. (Wyzowl)
- 18% use 360 video. (Wyzowl)
- 16% use Snapchat. (Wyzowl)
Platform Effectiveness Ratings
- 69% of respondents rated YouTube effective for video marketing. (Wyzowl)
- 56% rated Instagram effective. (Wyzowl)
- 55% rated Facebook effective. (Wyzowl)
- 50% rated LinkedIn effective. (Wyzowl)
- 42% rated webinars effective. (Wyzowl)
- 29% rated TikTok effective. (Wyzowl)
| Platform | Used by Video Marketers | Rated Effective |
| YouTube | 82% | 69% |
| 70% | 50% | |
| 69% | 56% | |
| 66% | 55% | |
| Webinars | 56% | 42% |
| TikTok | 40% | 29% |
Source: Wyzowl, 2026
YouTube Scale Signals
- 200 billion Shorts views average per day in 2026. (YouTube)
- 1+ billion hours watched on TVs every day in 2025. (YouTube)
- More than half of the top 100 most-watched YouTube channels had TV as their most-watched screen in 2025. (YouTube)
- 1+ billion monthly active viewers of podcast content in 2025. (YouTube)
- $70+ billion as reported by CNBC paid to creators, artists, and media companies during the three years reported in 2025. (YouTube)
- 3 million channels in the YouTube Partner Program in 2025. (YouTube)
Key implication: YouTube’s scale makes it a major discovery surface, while business marketers also distribute heavily on LinkedIn, Instagram, and Facebook. A search strategy can use YouTube for durable discovery and repurpose clips for channel-specific reach.
Video and SEO Statistics for Google Search
Google can surface video across several search experiences, while AI Search is changing how queries are formed. These statistics combine current search-scale data with Google’s own video indexing guidance.
Google Search and AI Search Scale
| Measure | Figure | Report Year |
| Google searches per year | 5T+ | 2025 |
| AI Overviews users | 1.5B+ | 2025 |
| AI Overviews countries and territories | 200+ | 2025 |
| AI Overviews languages | 40+ | 2025 |
Source: Google, 2025
Details:
- Google handled more than 5 trillion searches annually in 2025.
- AI Overviews reached more than 1.5 billion users in 2025, according to Bloomberg.
- According to Wikipedia, AI Overviews expanded to more than 200 countries and territories in 2025.
- AI Overviews supported more than 40 languages in 2025.
- In the U.S. and India, Google said AI Overviews drove more than 10% growth in usage for query types that showed them in 2025.
- Early AI Mode testers asked queries 2 to 3 times longer than traditional searches in Google’s 2025 testing.
Google’s Video Indexing and Surface Guidance
- VideoObject structured data can help Google understand a video’s description, thumbnail, upload date, and duration. (Google, 2026)
- Videos can appear in four major Google surfaces: main Search, Video mode, Google Images, and Discover. (Google, 2026)
- A valid thumbnail is required for eligibility in video features. (Google, 2026)
- LIVE badges are supported for eligible livestreams marked with BroadcastEvent structured data. (Google, 2026)
- Clip and SeekToAction markup help surface key moments in eligible videos. (Google, 2026)
Click Volume and Quality
- Total organic click volume was relatively stable year over year in 2025. (Google)
- Click quality increased slightly year over year in 2025. (Google)
- Google sends billions of clicks to the web every day. (Google)
Key implication: Google’s documentation gives site owners direct technical levers: accessible video files, valid thumbnails, structured data, and eligible key-moment markup. Those controls are more dependable than unsupported claims that video automatically improves rankings.
Video Ad Spend and Content Investment
Paid distribution sits beside organic search in many video programs. These statistics close the analysis with ad-spend growth and marketer investment priorities.
U.S. Digital Video Ad Spend
| Year | Spend | YoY Change |
| 2023 | $54.0B | +15% |
| 2024 | $63.8B | +18% |
| 2025 (projected) | $72.4B | +14% |
Source: IAB and Guideline, 2025
Details:
- U.S. digital video ad spend reached $63.8 billion in 2024. (IAB, 2025)
- IAB projected U.S. digital video ad spend at $72.4 billion in 2025. (IAB)
- U.S. digital video ad spend grew 18% in 2024. (IAB)
- IAB projected 14% growth for 2025. (IAB)
- The increase from $63.8B in 2024 to $72.4B in 2025 equals an $8.6 billion projected gain. (IAB)
Marketer Content Investment Priorities
- 29% of marketers used short-form video, tying images as the most-used content format in 2025. (HubSpot)
- 21% of marketers named short-form video as the content format with the highest ROI in 2025. (HubSpot)
- 16% of marketers named live-streaming video as the highest-ROI format in 2025. (HubSpot)
Planned Investment Increases
- 17% of marketers planned to increase short-form video investment in 2025. (HubSpot)
- 14% of marketers planned to increase live-streaming investment in 2025. (HubSpot)
- 30% of marketers planned to increase YouTube investment in 2025. (HubSpot)
Key implication: Spending data shows continued demand for video inventory, while marketers keep prioritizing short-form formats. Organic video SEO and paid video can share creative assets, but they should be measured against different acquisition goals.
How These Statistics Were Compiled
This video and SEO statistics roundup prioritizes primary releases from Wyzowl, Wistia, YouTube, Google, and IAB, plus HubSpot’s own marketer research. The working date window is 2024 to 2026. Older figures appear only when a source uses them to show a trend.
Conflicting measures are kept separate rather than averaged because scope, audience, geography, and methodology can differ. The research was reviewed in September 2026, and every numbered figure links to the source used for verification.
Conclusion
The video and SEO statistics point to three patterns: video use is widespread, short-form discovery is huge, and teams increasingly connect video to traffic, leads, sales, and AI-assisted production.
Search teams should:
- Pair strong video content with technical indexing basics
- Match clear intent across formats
- Ensure accessible video formats
- Implement business-level measurement
FAQ
What are the most important video and SEO statistics for 2026?
The clearest video and SEO statistics are adoption and scale. Wyzowl reports that 91% of businesses use video in 2026, while YouTube reports 200 billion daily Shorts views. Those figures show why search teams increasingly treat video as a core content format.
Does video help SEO traffic?
Video can support search-led traffic, but it should not be treated as an automatic ranking boost. In Wyzowl’s 2026 survey, 82% of video marketers said video increased web traffic. Google separately recommends technical steps that help it find and understand video content.
How does Google index video content?
Google says it can use VideoObject structured data to understand details such as a video’s thumbnail, description, upload date, and duration. For current video and SEO statistics, this matters because technical eligibility helps a video appear in Search, Video mode, Images, and Discover.
How popular is YouTube for video SEO?
YouTube remains very large as a discovery platform. Its 2026 CEO update says Shorts averages 200 billion daily views, and Wyzowl says 82% of video marketers use YouTube in 2026. These video and SEO statistics support treating YouTube as both a publishing and discovery channel.
What video length performs best?
There is no single best length for every goal. Wyzowl says 71% of respondents favor 30 seconds to 2 minutes for effectiveness in 2026, while Wistia found longer 30 to 60 minute videos can produce the highest interactive click rates. Match length to intent.
Are marketers using AI to create video?
Yes. Wyzowl reports 63% of video marketers used AI video tools in its 2026 study, up from 51% in the prior report. These video and SEO statistics suggest AI is moving into routine production, especially planning, captions, localization, and repurposing.
How much is spent on digital video advertising?
IAB reported U.S. digital video ad spend of $63.8 billion in 2024 and projected $72.4 billion for 2025. That forecast represented 14% growth, keeping paid video relevant alongside organic video and SEO statistics.
What video SEO data should a business benchmark?
Useful benchmarks include play rate, engagement, assisted conversions, lead-form clicks, web traffic, and sales. Wistia measured 53% to 55% lead-form click-through rates for strong placements in 5 to 30 minute videos, giving teams a concrete conversion reference.